Project V: Analyzing US Economic Data and Building a Dashboard
Key Learning Outcomes:
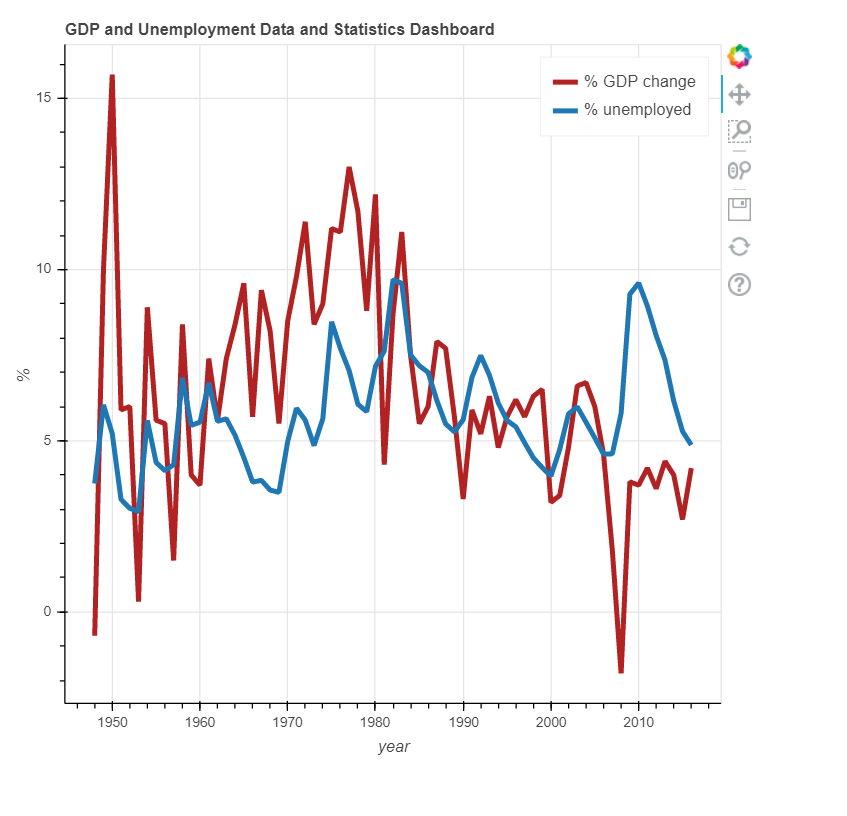
- Use of BokehJS to visualize my extracted data
- Define a Function that Makes a Dashboard
- Create a dataframe that contains the GDP data and display it
- Create a dataframe that contains the unemployment data and display it
- Display a dataframe where unemployment was greater than 8.5%
- Use the function make_dashboard to make a dashboard
- Use of IBM Watson Cloud
- Save the dashboard on IBM cloud and display it
Code available upon request.